Electricity Distribution Services
In 2012, electricity delivery to networks of SDCs was 649.9 billion kWh, while electricity delivery from networks of SDCs to customers and allied territorial grid organizations (TGOs) was 597.2 billion kWh, with actual electricity losses totaling 52.7 billion kWh, or 8.11%.
TABLE 4. ELECTRICITY LOSSES IN 2012
| Item | SDC/Branch Name | Delivery to Networks | Delivery from Networks to Customers and Allied TGOs | Electricity Losses | |
|---|---|---|---|---|---|
| million kWh | million kWh | million kWh | % | ||
| 1. | IDGC of Centre | 63,968.46 | 57,870.52 | 6,097.94 | 9.53% |
| 2. | IDGC of Center and Volga Region | 59,682.91 | 54,539.09 | 5,143.83 | 8.62% |
| 3. | IDGC of Volga | 61,365.83 | 57,462.18 | 3,903.64 | 6.36% |
| 4. | IDGC of North-West | 43,239.29 | 40,467.64 | 2,771.65 | 6.41% |
| 5. | IDGC of Siberia | 80,568.06 | 74,004.80 | 6,563.25 | 8.15% |
| 6. | TDC | 6,629.49 | 6,039.37 | 590.12 | 8.90% |
| 7. | IDGC of Urals | 76,065.29 | 70,080.89 | 5,984.40 | 7.87% |
| 8. | IDGC of South | 30,176.60 | 27,262.39 | 2,914.20 | 9.66% |
| 9. | IDGC of Northern Caucasus | 11,131.78 | 9,561.53 | 1,570.25 | 14.11% |
| 10. | Kubanenergo | 20,767.39 | 18,092.61 | 2,674.78 | 12.88% |
| 11. | MOESK | 86,915.65 | 78,546.10 | 8,369.55 | 9.63% |
| 12. | LENENERGO | 34,513.04 | 30,934.64 | 3,578.41 | 10.37% |
| 13. | Tyumenenergo | 70,870.03 | 69,061.22 | 1,808.81 | 2.55% |
| 14. | Yantarenergo | 4,052.48 | 3,326.42 | 726.06 | 17.92% |
| Total for MRSK Holding | 649,946.28 | 597,249.40 | 52,696.87 | 8.11% | |
Actual electricity losses in networks of SDCs in 2012 decreased by 1.4 billion kWh against 2011. With an increase of 1.57% in delivery to distribution networks as compared with 2011, losses fell by 0.35% in relative terms. An analysis of changes in delivery from networks within the boundaries of balance participation shows that net electricity delivery rose by 11.5 billion kWh (+1.96%).
Compared with 2011, losses decreased by 0.35% in relative terms
TABLE 5. ACTUAL ELECTRICITY LOSSES IN 2011–2012
| № | SDC/Branch Name | Electricity Losses, 2011 | Electricity Losses, 2012 | Changes in Losses | |||
|---|---|---|---|---|---|---|---|
| million kWh | % in comparable conditions | million kWh | % | million kWh | % in comparable conditions | ||
| 1. | IDGC of Centre | 6,247.24 | 9.96 | 6,097.94 | 9.53 | −149.30 | −0.42 |
| 2. | IDGC of Center and Volga Region | 5 353.71 | 8.98 | 5143.83 | 8.62 | −209.89 | −0.37 |
| 3. | IDGC of Volga | 4 207.47 | 6.90 | 3 903.64 | 6.36 | −303.83 | −0.53 |
| 4. | IDGC of North-West | 2 747.06 | 6.42 | 2771.65 | 6.41 | 24.59 | −0.01 |
| 5. | IDGC of Siberia | 6 875.86 | 8.78 | 6 563.25 | 8.15 | −312.60 | −0.64 |
| 6. | TDC | 576.08 | 8.98 | 590.12 | 8.90 | 14.04 | −0.07 |
| 7. | IDGC of Urals | 6 179.42 | 8.15 | 5 984.40 | 7.87 | −195.03 | −0.28 |
| 8. | IDGC of South | 2 842.21 | 9.48 | 2 914.20 | 9.66 | 72.00 | 0.17 |
| 9. | IDGC of Northern Caucasus | 1 589.63 | 14.37 | 1 570.25 | 14.11 | −19.38 | −0.26 |
| 10. | Kubanenergo | 2 783.71 | 13.93 | 2 674.78 | 12.88 | −108.94 | −1.05 |
| 11. | MOESK | 8 695.59 | 10.33 | 8 369.55 | 9.63 | −326.04 | −0.70 |
| 12. | LENENERGO | 3 546.44 | 10.60 | 3 578.41 | 10.37 | 31.96 | −0.23 |
| 13. | Tyumenenergo | 1 789.69 | 2.53 | 1 808.81 | 2.55 | 19.11 | 0.02 |
| 14. | Yantarenergo | 667.90 | 17.29 | 726.06 | 17.92 | 58.15 | 0.62 |
| Total for MRSK Holding | 54,102.03 | 8.46 | 52,696.87 | 8.11 | −1,405.16 | −0.35 | |
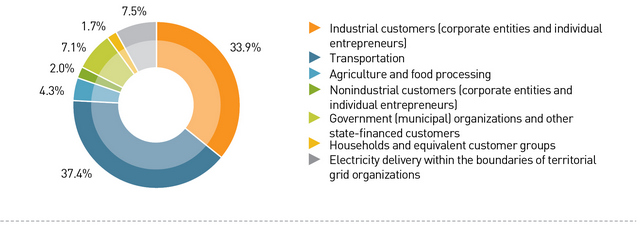
DIAGRAM 3. BREAKDOWN OF ELECTRICITY DELIVERY FROM SDCS’ NETWORKS IN 2012 BY CUSTOMER GROUP
 Скачать в XLS
The changes in losses in absolute terms are due to the following major factors:
- changes in electricity delivery to the distribution grid determine changes in variable (load-related) losses of electricity;
- FGC UES networks’ operation conditions different from normal operation conditions (emergency conditions, repair conditions, etc.), which leads to considerable redistribution of electricity flows in networks of SDCs and changed quantity of transit losses;
- the Company’s strategy for the consolidation of regional electric grid assets—as a rule, medium- and low-voltage networks with losses higher than average losses of SDCs come under the management of the Company’s SDCs’ SDCs;
- energy efficiency is raised due to organizational and technical measures aimed at improving systems of electricity billing metering and technical metering.
According to the figure, the major share of electricity delivery from networks of the Company’s SDCs is the “industrial customers” group (37.4%) and delivery to networks of territorial grid companies (33.9%). The volume of electricity delivered to the “households” group is 7.5%.
ENERGY CONSERVATION AND ENERGY EFFICIENCY ENHANCEMENT
The Company focuses its activities in energy conservation and energy efficiency enhancement on:
- organization of SDCs’ activities in energy conservation and energy efficiency enhancement;
- the Company’s participation in improving the regulatory and legal framework;
- creation and improvement of conditions for developing and implementing innovative technologies in the distribution grid sector;
- work on ensuring the implementation of the energy conservation and energy efficiency enhancement programs of SDCs.
All MRSK Holding SDCs formulated their energy conservation and energy efficiency enhancement programs in 2012.
The following targets of energy conservation and energy efficiency enhancement were approved in accordance with the programs of energy conservation of the Company’s SDCs:
- decrease in per-unit consumption of energy resources for production and business needs;
- reduction of electricity losses;
- implementation of the long-term development programs for electricity metering systems in the retail electricity markets.
In 2012, the effect of electricity loss reduction measures was 2,326.3 million kWh (5,633 million rubles). The table below shows the results of the principal measures taken to reduce electricity network losses in 2012.
TABLE 6. MEASURES TO REDUCE ELECTRICITY LOSSES
| Item | Programs/Measures | Effect
(million kWh) | Effect
(rubles in millions) |
|---|---|---|---|
| 1. | Target-oriented measures, including | 1,459.6 | 3,560 |
| 1.1. | Organizational measures | 1,424.2 | 3,448 |
| 1.2. | Technical measures | 35.4 | 112 |
| 2. | Ancillary measures, including | 866.7 | 2,073 |
| 2.1. | Development program for electricity metering systems | 760.3 | 1,844 |
| 2.2. | Technical upgrading program | 53.7 | 82 |
| 2.3. | Repair program measures | 43.4 | 128 |
| 2.4. | Long-term distribution grid development program | 8.6 | 13 |
| TOTAL | 2,326.3 | 5,633 |
In 2012, the effect of measures to reduce energy resource consumption for business needs was 55.7 million rubles. The table below shows the results of the target-oriented measures taken in 2012 to reduce energy resource consumption for production and business needs.
TABLE 7. PRINCIPAL MEASURES TO REDUCE ENERGY RESOURCE CONSUMPTION FOR PRODUCTION AND BUSINESS NEEDS IN 2012
| Item | Programs/Measures | Unit of Measurement | Effect
(in physical terms) | Effect
(rubles in millions) |
|---|---|---|---|---|
| 1. | Electricity | million kWh | 17.2 | 41.7 |
| 2. | Heat | Gcal | 7,452.6 | 13.3 |
| 3. | Hot water supply | thsd cbm | 0.1 | 0.1 |
| 4. | Cold water supply | thsd cbm | 24.1 | 1.1 |
| 5. | Natural gas | thsd cbm | 96 | 0.4 |
| TOTAL | − | 55.6 |
In accordance with Federal Act No. 261-FZ of November 23, 2009, On Energy Conservation and Energy Efficiency Enhancement and on Amendments to Certain Acts of the Russian Federation, the Company organized work in 2012 on energy audits of SDCs. In 2012, the Company inspected buildings and structures used for production and administrative purposes and electric grid facilities.
In total, the Group developed approximately 237,000 targeted measures, enabling it to realize the identified potential in the conservation of primary energy resources as shown below:
- electricity: 12,149.8 million kWh, including electricity losses of 11,811.5 million kWh;
- heat: 146 thousand Gcal;
- water: 740.2 thousand cubic meters (cbm);
- natural fuel: 58.48 thousand tonnes of fuel equivalent, including engine fuel of 43.6 thousand tonnes of fuel equivalent.
In money terms, the potential identified by energy audits in energy conservation and energy efficiency enhancement is 30,678 million rubles, including 28,655 million rubles resulting from measures to reduce electricity losses.
In accordance with Federal Act No. 261-FZ of November 23, 2009, On Energy Conservation and Energy Efficiency Enhancement and on Amendments to Certain Acts of the Russian Federation and the existing the long-term development programs for electricity metering systems, MRSK Holding’s operating entities in 2012 installed more than 840,000 modern electricity meters. More than 780,000 points of electricity delivery for household customers were upgraded, including more than 49,800 points of common electricity metering for apartment buildings. In addition, as requested by household customers, 187,300 electricity meters were replaced/installed in 2012.