Financial Performance of the Company (IFRS)
Revenue
Holding’s revenue is principally derived from electricity distribution services that account for 84.72% of total reported revenue in 2012. Other major revenue sources include connection services and electricity sales. Government subsidies come in the form of compensation for low electricity tariffs in some of the regions where the Company operates, and represent a very small portion of total reported revenue (0.03% in 2012).
| 2012 | 2011 | |||
|---|---|---|---|---|
| RUB million | % of total | RUB million | % of total | |
| Electricity transmission | 526,656 | 84.72% | 552,634 | 87.08% |
| Technological connection services | 44,592 | 7.7% | 40,099 | 6.32% |
| Electricity sales | 39,690 | 6.38% | 31,794 | 5.01% |
| Other revenues | 10,535 | 1.69% | 9,838 | 1.55% |
| 621,473 | 99.97% | 634,365 | 99.96% | |
| Government subsidies | 160 | 0.03% | 243 | 0.04% |
| 621,633 | 100.00% | 634,608 | 100.00% | |
Electricity transmission revenue decreased by 4.70% in 2012 compared to 2011, and total reported revenue and government subsidies decreased by 34.16%. Total revenue decreased by 2.04%, as government subsidies were compensated by increase of revenues from Technological connection services, Electricity sales and other revenue.
Operating Results
The Group’s operating expenses arise primarily from expenses on electricity transmission, electricity purchase for compensation of technological losses, personnel costs, and depreciation and amortization costs. The share of costs of electricity transmission and personnel costs remained almost the same as a proportion of total operating expenses in 2011, while purchased electricity for compensation of technological losses decreased in 2012 in both absolute terms and as a percentage share of total operating expenses.
| 2012 | % of total | 2011 | % of total | |
|---|---|---|---|---|
| Electricity transmission | 214,475 | 37.35% | 220,969 | 38.28% |
| Personnel costs | 108,496 | 18.90% | 104,615 | 18.12% |
| Purchased electricity for compensation of technological losses | 74,300 | 12.94% | 94,663 | 16.40% |
| Depreciation and amortization | 61,499 | 10.71% | 54,075 | 9.37% |
| Purchased electricity for resale | 22,797 | 3.97% | 17,525 | 3.04% |
| Raw materials and supplies | 17,393 | 3.03% | 15,905 | 2.76% |
| Repairs, maintenance and installation services | 13,251 | 2.31% | 14,902 | 2.58% |
| Provisions | 9,194 | 1.60% | 4,750 | 0.82% |
| Impairment of trade and other receivables | 6,913 | 1.20% | 7,668 | 1.33% |
| Rent | 5,256 | 0.92% | 6,087 | 1.05% |
| Consulting, legal and audit services | 5,243 | 0.91% | 4,712 | 0.82% |
| Impairment of property, plant and equipment | 4,626 | 0.81% | - | - |
| Taxes other than income tax | 3,130 | 0.55% | 2,683 | 0.46% |
| Utilities | 2,875 | 0.50% | 3,098 | 0.54% |
| Other expenses | 24,749 | 4.31% | 25,562 | 4.43% |
| 574,197 | 100.00% | 577,214 | 100.00% |
Electricity transmission costs decreased by 2.94% in 2012 compared to 2011.
Depreciation and amortization costs increased by 13.73%, from RUB 54,075 million in 2011 to RUB 61,499 million in 2012.
Personnel costs are up by 3.71%. The increase is largely driven by growth in wages in salaries and social security contribution (up by 3.76% and 3.81% respectively). Expense on the post-employment defined benefit plan and expense in respect on long-term service benefits provided decreased by 33.68% and 110.76% respectively.
Total operating expenses decreased only by 0.52% to RUB 574,197 million and thus remained approximately on the level with the amount of 2011.
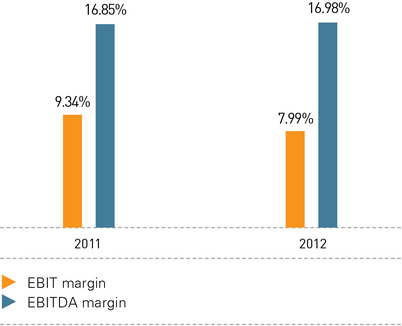
In 2012, EBIT decreased by 16.14%, from RUB 59,254 million in 2011 to RUB 49,688 million in 2011. EBIT margin decreased from 9.34% in 2011 to 7.99% in 2012, primarily due to the increase in depreciation and amortization expenses (13.73%) and electricity transmission costs.
EBITDA for 2012 was RUB 117,238 million, compared to RUB 116,507 million in previous year, which represents an increase of 0.63%. EBITDA margin remained stable at 18.86%.
Financing costs and EBT
Net finance costs decreased to RUB 5,641 million in 2011 from RUB 5,843 million in the corresponding period (-3.46%). This was primarily driven by a 53.24% decrease in financial leasing costs. Total finance income increased by 89.96% to RUB 6,128 million, mostly represented by interest income on loans, bank deposits, and promissory notes.
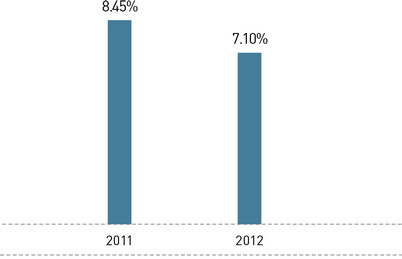
EBT decreased in 2012 to RUB 44,117 million from RUB 53 655 million last year (-17.78%). EBT decreased in 2012 approximately at the same rate as EBIT. Pretax margin in 2012 was 7.10% (compared to 8.45% in 2011).
Taxation
The total income tax expense for 2012 of RUB 12 463 million represents a decreased of 15.15% compared to the previous year (RUB 14,689 million). Total income tax expenses comprises current tax expense of RUB 9,377 million and a deferred tax expense of RUB 3,086 million. Current tax expense in 2012 decreased by 9.04% compared to 2011 and deferred tax expense went down by 29.54% compared to the previous year.
Profit for the year and earnings per share
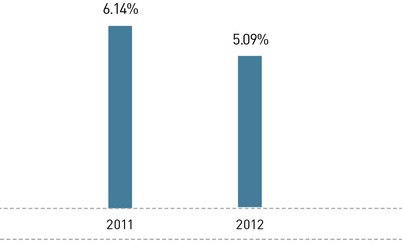
In 2012, net profit for the year decreased by 18.77% to RUB 31,654 million compared to RUB 38,966 million in 2011. Net profit margin in 2012 was 5.09%, which is less than in 2011 (6.14%).
Profit attributable to ordinary shareholders decreased in 2012 to RUB 16,621 million from RUB 22,348 million in 2011 (a decrease of 25.63%). Basic earnings per share (EPS) are based on the profit attributable to ordinary shareholders and a weighted average number of shares outstanding, which increased from 42,528 million shared in 2011 to 47,015 million shared in 2012. As a result, basic EPS decreased by 33.96% from RUB 0.53 in 2011 to RUB 0.35 in 2012. The company has no dilutive instruments, so basic EPS and diluted EPS are equal.
ROA and ROE
Return on assets (ROA) in 2012 was 3.25%, more than in the 2011 - 4.43%. Return on equity (ROE) decreased in 2012 and amounted to 6.4% compared to 8.78% in 2011.
CAPITAL STRUCTURE AND OFF-BALANCE-SHEET SETTLEMENTS
Assets
During the year, total assets increased by 10.65% from RUB 879,077 million in 2011 to RUB 972,736 million in 2012. Non-current assets increased by 9.62% from RUB 722,391 million in 2011 to RUB 791,849 million.
The Company’s total equity increased by 11.45%, from RUB 443,877 million in 2011 to RUB 494,686 million in 2012, primarily on the back of reserve for prepayment for shares in the amount of RUB 19,751 million (+ 110.52% in 2012) and share premium in the amount of RUB 16,244 million (+ 169,12% in 2012).
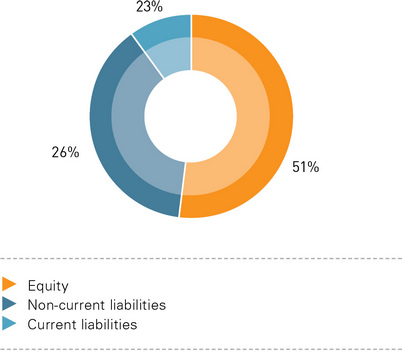
Total liabilities increased by 9.85% from RUB 435,200 million in 2011 to RUB 478,050 million in 2012. Percentage share of non-current in total liability structure experienced a small decrease from 55.39% in 2011 to 53.18% in 2012. In absolute terms, non-current liabilities were RUB 254,214 million in 2012, a 5.46% increase compared to RUB 241,050 million in 2011.
Financial leverage remained stable over 2012. When measured as the ratio of average total assets for the year to average total equity, it decreased to 1.97 in 2012 from 1.98 in 2011. Other measures of long-term financial solvency as of year end are presented below and also illustrate the Company’s financial stability:
| Ratio | 2012 | 2011 | Change |
|---|---|---|---|
| Total debt to total assets | 0.24 | 0.23 | 4.56% |
| Long term debt (LTD) to total equity | 0.38 | 0.38 | 0.32% |
| Total debt to total equity | 0.46 | 0.45 | 3.82% |
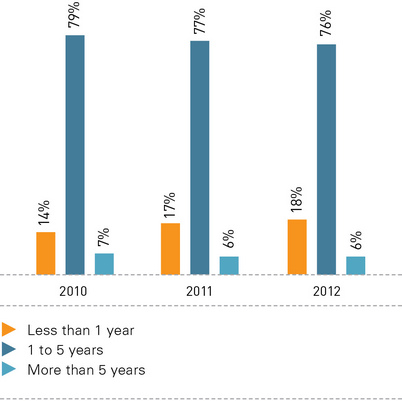
The maturity profile of the Company’s debt obligations are set forth in the diagrams below:
The Company’s ability to repay debt obligations as measured by coverage ratios remains strong. Interest coverage ratio, calculated as EBIT to annual interest payments, decreased from 8.69 in 2011 to 4.64.
Liquidity
Total current assets represented 18.60% of total assets in 2012, a slight increase compared to the 17.82% share of current assets in the total asset base in 2011. In absolute terms, current assets increased from RUB 156,686 million in 2011 to RUB 180,887 million in 2012, a 15.45% increase.
Current assets structure can be analyzed as follows:
| Component | 2011 | 2010 | ||
|---|---|---|---|---|
| RUB million | % of total | RUB million | % of total | |
| Inventories | 13,742 | 7.60% | 12,907 | 8.24% |
| Other investments and financial assets | 35,105 | 19.41% | 8,728 | 5.57% |
| Current tax assets | 3,156 | 1.74% | 4,516 | 2.88% |
| Trade and other receivables | 93,193 | 51.52% | 81,682 | 52.13% |
| Cash and cash equivalents | 35,691 | 19.73% | 48,853 | 31.18% |
| Total current assets | 180,887 | 100.00% | 156,686 | 100.00% |
A major trend in current asset structure is an increase in other investments and financial assets, which increased by 302.21% compared to the previous year.
The percentage share of current liabilities in total liabilities structure increased from 44.61% in 2011 to 46.82% in 2012 and it was primarily due to an increase in provisions and current tax liabilities. An increase of 15.29% was observed in absolute terms, from RUB 194,150 million in 2011 to RUB 223,836 million in 2012.
CURRENT LIABILITIES STRUCTURE CAN BE ANALYZED AS FOLLOWS:
| Component | 2011 | 2010 | ||
|---|---|---|---|---|
| RUB million | % of total | RUB million | % of total | |
| Loans and borrowings | 40,098 | 17.91% | 28,965 | 14.92% |
| Trade and other payables | 168,263 | 75.17% | 158,689 | 81.74% |
| Provisions | 14,106 | 6.30% | 5,977 | 3.08% |
| Current tax liabilities | 1,369 | 0.61% | 519 | 0.27% |
| Total current liabilities | 223,836 | 100.00% | 194,150 | 100.00% |
As demonstrated in the table above, current liabilities structure remained quite stable.
The working capital remained negative and changed from minus RUB 37,464 million to minus RUB 42,949 million.
Cash Flow
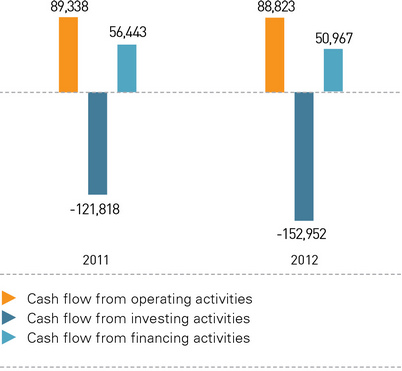
Net cash flow from operating activities decreased by 0.58%, from RUB 89,338 million in 2011 to RUB 88,823 million in 2012.
Net cash flow used in investing activities in absolute terms decreased by 25,56% from minus RUB 121,818 million in 2011 to RUB minus 152,952 million in 2012.
Net cash flow used in financing activities decreased by 9.70% from RUB 56,443 million in 2011 to RUB 50,967 million in 2012.
In 2012 net decrease in cash and cash equivalents was minus RUB 13 162 million compared to the previous year of RUB 23,963 million.