Financial Performance of the Company
The Company’s current condition is characterized by the following key financial indicators.
Assets of the Company
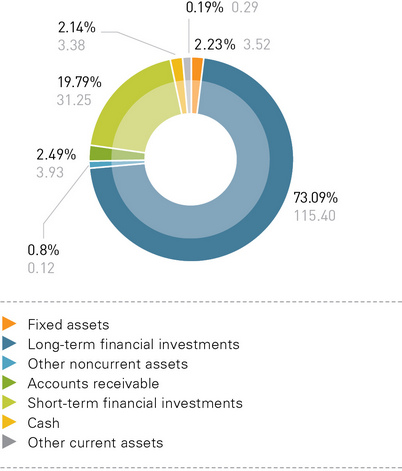
As of December 31, 2012, the book value of the Company’s assets was assessed at 157.9 billion rubles. For the period from January 1, 2012, the asset value increased by 22.1 billion rubles (16.3%). The net asset value was 137.5 billion rubles.
Long-term financial investments accounted for the largest share in the Company’s aggregate assets (73.09%). Fixed assets and construction in progress accounted for 2.23%. Total accounts receivable accounted for 2.49%. The share of cash and short-term financial investments was 21.9%.
Compared with 2011, changes in noncurrent assets are characterized by two key factors. First, in the reporting period, the share of long-term financial investments in the total assets decreased by 7.9%. As of the end of the reporting period, the value of long-term financial investments rose by 5.32 billion rubles (4.8%), totaling 115.4 billion rubles. The Company completed the following transactions in the reporting period in relation to the inflow/outflow of long-term financial investments:
- the purchase of shares worth 4.7 billion rubles in Kubanenergo;
- the purchase of shares worth 2.5 billion rubles in IDGC of Northern Caucasus;
- the purchase of shares worth 2.04 billion rubles in LENENERGO;
- a loan of 2.3 billion rubles extended to Tyumenenergo.
As at December 31, 2012, the shares whose current market value could be determined were reflected in accounting statements at current market value. The difference between the market value and the reported value as at December 31, 2012, was – 6.8 billion rubles.
Shares in Kubanenergo were reclassified under “subsidiaries” instead of “dependent companies” due to an increase in the Company’s stake in Kubanenergo from 45.77% to 63.01%.
Second, changes in noncurrent assets were affected by a slight decrease in the share of fixed assets and construction in progress (0.4%). In total, the value of fixed assets and construction in progress in 2012 rose by 31 million rubles (0.9%).
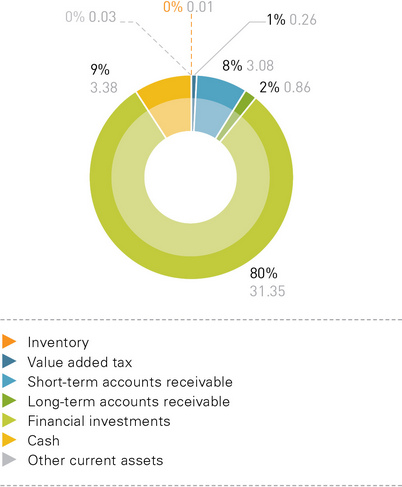
The key changes in current assets in 2012 were as follows:
- Cash and short-term financial investments accounted for 89% of the current assets. The Company’s absolute liquid assets in the reporting period reached 34.63 billion rubles.
- The share of accounts receivable in the working capital decreased by 5.8%. The Company’s total receivables rose by 0.41 billion rubles, or 11.6%, including an increase of 0.28 billion rubles in long-term accounts receivable, with short-term accounts receivable going up by 0.13 billion rubles in 2012.
- Inventory in the reporting period fell by 50% and totaled 0.02% of the current assets.
- The share of input value added tax in the current assets changed from 2.57% to 0.67%, with the amount of VAT going down by 45%.
The table below shows the Company’s liquidity and financial solvency indicators.
| Liquidity and Financial Solvency Indicators | As of December 31, 2010 | As of December 31, 2011 | As of December 31, 2012 |
|---|---|---|---|
| Liquid ratio | 1.02 | 1.78 | 1.70 |
| Quick ratio | 1.75 | 2.08 | 1.85 |
| Current ratio | 1.89 | 2.19 | 1.91 |
| Equity to total assets ratio | 0.96 | 0.92 | 0.87 |
| Capital ratio | 0.46 | 0.54 | 0.48 |
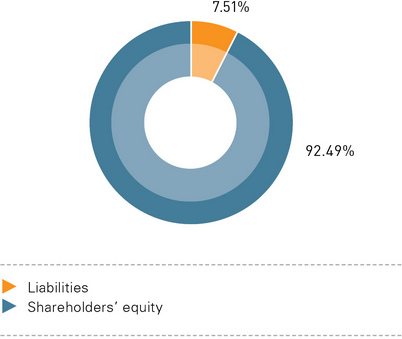
Liabilities of the Company
The share of shareholders’ equity in the Company’s total liabilities fell by 5.4% in 2012. The value of shareholders’ equity in absolute terms increased by 11.9 billion rubles. As at the end of 2011, the Company’s undistributed profit totaled 72.4 billion rubles. As at the end of 2012, its undistributed profit went down by 3.2 billion rubles and totaled 72.4 billion rubles. The decrease was due primarily to the revaluation of financial investments at current market value in the amount of -6.8 billion rubles.
Compared with 2010 and 2011, the structure of the Company’s liabilities did not change in 2012. In the reporting period, the share of long-term liabilities (4.1 million rubles) was 0.02% of the total liabilities (0.94% in 2011), while short-term liabilities (20.38 billion rubles) accounted for 99.98% (99.1% in 2011). Accounts payable in the reporting period rose 2.1-fold (by 10.3 billion rubles).
Substantial changes in payables were due to the clearing of the advance payment of 9.38 billion rubles received in 2011 and due to the clearing of the advance payment of 5.73 billion rubles received in the 1st quarter of 2012 for the purchase of the Company’s additionally issued shares (the share issue was registered on November 10, 2011) and due to the receipt of the advance payment of 19.75 billion rubles in December 2012 for the Company’s additionally issued shares (the share issue was registered on December 3, 2012).
As of December 31, 2012, the Company’s absolute liquid assets (cash and cash equivalents) covered all of its liabilities.
FINANCIAL PERFORMANCE OF SUBSIDIARIES
The Company’s approach to the financial management of its subsidiaries is determined by the scope and geographical extent of its activities. In 2012, the Company continued to pursue its centralized policy aimed at controlling external financing, which made it possible to keep the value of consolidated debt on the best market conditions.
The Company’s subsidiaries operate a financial management and control system based on influencing subsidiaries’ activities by means of the interaction with them through their boards of directors:
- with respect to cash flow management of subsidiaries, through the establishment of cash flow benchmarks;
- with respect to financial solvency management of subsidiaries, through the implementation of control procedures specified in the approved debt position management standards, prescribing a system of limits on the amount of borrowed capital and making it possible to forecast financial solvency and establish management’s authority to make financial decisions.
Although the financial market situation constantly deteriorated from early 2012; owing to the policies pursued by subsidiaries, they managed to keep the weighted average loan interest rate unchanged amid a substantial rise in lending rates. The weighted average interest rate for subsidiaries at the end of 2012 was 8.72% p.a.
The current debt financing policy is based on the following fundamental principles:
- Companies should attain the reasonable diversification of debt.
- Currency risks should be minimized.
- The ratios specified in financial covenants under loan agreements should be maintained.
- The debt portfolio should be optimized in terms of the ratio between short-term and long-term debts.
- Companies should obtain unsecured loans.
- Credit histories should be kept impeccable.
FINANCIAL PERFORMANCE OF SUBSIDIARIES
Аssets of Distribution Grid Companies
The total value of the Company-managed distribution grid companies’ assets was 1,083.3 billion rubles as of December 31, 2012. This indicator grew by 11.05% on 2011. The aggregate net asset value was 648.5 billion rubles, which is 1.1 times the amount reported for 2011.
Noncurrent assets accounted for the largest share in distribution grid companies’ aggregate assets (84%), including fixed assets accounting for 81%. Therefore, current assets accounted for at most 16%, including accounts receivable accounting for 10.3%.
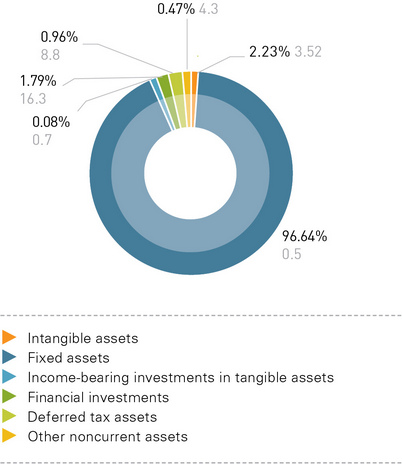
STRUCTURE OF DISTRIBUTION GRID COMPANIES’ AGGREGATE NONCURRENT ASSETS (RUBLES IN BILLIONS, %)
 Скачать в XLS
 The structure of MRSK distribution grid companies’ aggregate noncurrent assets is shown in the diagram below:
At the end of 2012, the value of distribution grid companies’ fixed assets was 877.8 billion rubles, including the value of construction in progress of about 84.7 billion rubles. The value of long-term financial investments was about 16.3 billion rubles at the end of 2012.
At the end of 2012, the value of fixed assets was up by 96.62 billion rubles, with the value of construction in progress going down by 1 billion rubles. The value of long-term financial investments increased by 5.2 million rubles to 16.3 billion rubles.
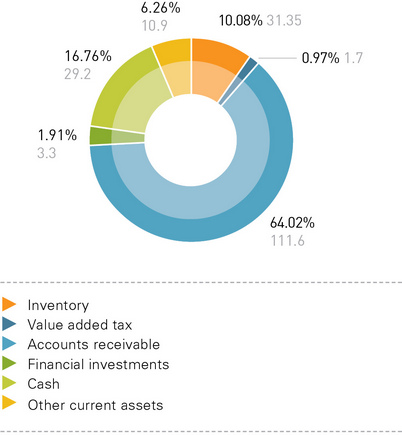
At the end of 2012, distribution grid companies’ current assets totaled 174.4 billion rubles (or 16.1% of the total assets). Inventory accounted for 10.08% of the current assets (17.6 billion rubles). The low level of inventory was due to the specific nature of the companies’ operating activities: their core business is electricity distribution and network connections.
Accounts receivable were 111.6 billion rubles (or 64.02% of the aggregate current assets), including long-term accounts receivable in the amount of 28.1 billion rubles (or 16.2% of the aggregate current assets) and short-term accounts receivable in the amount of 83.5 billion rubles (or 47.87% of the aggregate current assets). Trade receivables accounted for about 68.9% (57.6 billion rubles) of short-term accounts receivable.
Cash and short-term financial investments accounted for 18.7% of the aggregate current assets (32.5 billion rubles), including 29.2 billion rubles of cash at banks and on hand. The cash balance at banks at the end of 2012 decreased by 4.5 billion rubles compared with the previous year.
STRUCTURE OF DISTRIBUTION GRID COMPANIES’ AGGREGATE CURRENT ASSETS (RUBLES IN BILLIONS, %)
 Скачать в XLS
 Liabilities of Distribution Grid Companies
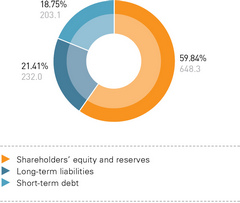
Shareholders’ sources (equity and reserves) accounted for the largest share in the aggregate of sources forming distribution grid companies’ assets (59.8%). The additional paid-in capital accounted for the largest share in the shareholders’ sources (388.1 billion rubles, or 59.9% of the total amount), while the additional paid-in capital without a revaluation of noncurrent assets accounted for about 41,1%. The authorized capital accounted for about 21% (135.7 billion rubles). The undistributed profit amount reached 120.9 billion rubles, or 18.6% of the shareholders’ sources.
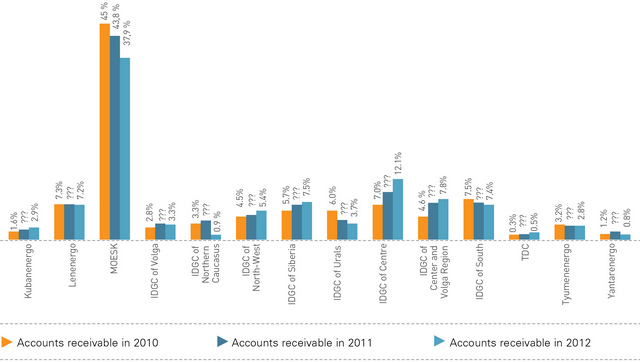
CHANGES IN SHARES OF DISTRIBUTION GRID COMPANIES’ AGGREGATE ACCOUNTS RECEIVABLE IN IDGCS’ AGGREGATE LONG-TERM AND SHORT-TERM ACCOUNTS RECEIVABLE
 Скачать в XLS
 In relation to assessing changes in shareholders’ sources in 2012, the reporting year particularly witnessed a rise in the additional paid-in capital (up by 27.8 billion rubles) and the undistributed profit (up by 18.4 billion rubles).
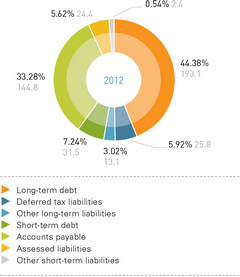
Distribution grid companies’ liabilities (Sections 4 and 5 of their respective balance sheets) as of December 31, 2012, totaled 435.1 billion rubles, including:
- long-term liabilities of 231.9 billion rubles, with long-term loans and advances accounting for 83.3% (193.1 billion rubles);
- short-term liabilities of 203.1 billion rubles, including 31.5 billion rubles in outstanding loans (15.5%) and 144.8 billion rubles in accounts payable (71.3%).
Liabilities accounted for 40.2% of the consolidated balance sheet total. Short-term and long-term liabilities accounted for 18.7% and 21.4% respectively. The share of short-term liabilities decreased by 0.2% compared with 2011 (notwithstanding an increase of 18.7 billion rubles in absolute terms). The share of long-term liabilities in the consolidated balance sheet total of distribution grid companies rose by 0.9% on 2011 (an increase of 32.15 billion rubles in absolute terms).
An important indicator is the receivables to payables ratio, which was 0.77 as at the end of 2012.
The table below shows distribution grid companies’ liquidity indicators:
| Company |
Liquid Ratio (standard values: 0.2 to 0.3) | ||
|---|---|---|---|
| 2010 | 2011 | 2012 | |
| Kubanenergo | 0.63 | 0.45 | 0.21 |
| LENENERGO | 0.01 | 0.24 | 0.20 |
| MOESK | 0.02 | 0.05 | 0.13 |
| IDGC of Volga | 0.36 | 0.28 | 0.40 |
| IDGC of Northern Caucasus | 0.04 | 0.04 | 0.15 |
| IDGC of North-West | 0.20 | 0.25 | 0.13 |
| IDGC of Siberia | 0.06 | 0.09 | 0.02 |
| IDGC of Urals | 0.14 | 0.09 | 0.20 |
| IDGC of Centre | 0.02 | 0.25 | 0.07 |
| IDGC of Center and Volga Region | 0.42 | 0.74 | 0.35 |
| IDGC of South | 0.02 | 0.16 | 0.12 |
| TDC | 0.53 | 0.78 | 0.25 |
| Tyumenenergo | 0.40 | 0.30 | 0.23 |
| Yantarenergo | 0.04 | 0.02 | 0.01 |
An analysis of the liquid ratio shows that distribution grid companies’ quickest assets equal 0.2 on average, which corresponds to standard values.
STRUCTURE OF DISTRIBUTION GRID COMPANIES’ AGGREGATE LIABILITIES (RUBLES IN BILLIONS, %)
 Скачать в XLS
 STRUCTURE OF DISTRIBUTION GRID COMPANIES’ AGGREGATE LONG-TERM AND SHORT-TERM LIABILITIES (RUBLES IN BILLIONS, %)
 Скачать в XLS
 | Company |
Current Ratio (standard values: 1 to 2) | ||
|---|---|---|---|
| 2010 | 2011 | 2012 | |
| Kubanenergo | 0.86 | 0.84 | 0.52 |
| LENENERGO | 0.40 | 0.53 | 0.52 |
| MOESK | 0.88 | 1.06 | 1.03 |
| IDGC of Volga | 1.38 | 1.17 | 1.41 |
| IDGC of Northern Caucasus | 0.97 | 0.35 | 0.43 |
| IDGC of North-West | 1.25 | 1.21 | 1.49 |
| IDGC of Siberia | 0.77 | 0.66 | 0.73 |
| IDGC of Urals | 1.09 | 1.00 | 0.95 |
| IDGC of Centre | 1.08 | 1.24 | 1.17 |
| IDGC of Center and Volga Region | 1.23 | 1.59 | 1.37 |
| IDGC of South | 0.49 | 1.20 | 0.76 |
| TDC | 1.24 | 1.33 | 0.98 |
| Tyumenenergo | 1.05 | 0.77 | 0.60 |
| Yantarenergo | 0.80 | 1.15 | 0.46 |
An analysis of the current ratio makes it possible to calculate how short-term liabilities are covered by current assets. The average ratio of distribution grid companies is 0.9, with standard values ranging between 1 and 2.
| Company |
Equity to Total Assets Ratio (standard value: 0.5) | ||
|---|---|---|---|
| 2010 | 2011 | 2012 | |
| Kubanenergo | 0.35 | 0.38 | 0.39 |
| LENENERGO | 0.58 | 0.52 | 0.58 |
| MOESK | 0.56 | 0.58 | 0.60 |
| IDGC of Volga | 0.80 | 0.73 | 0.71 |
| IDGC of Northern Caucasus | 0.69 | 0.60 | 0.63 |
| IDGC of North-West | 0.70 | 0.66 | 0.60 |
| IDGC of Siberia | 0.60 | 0.58 | 0.57 |
| IDGC of Urals | 0.65 | 0.66 | 0.63 |
| IDGC of Centre | 0.65 | 0.59 | 0.54 |
| IDGC of Center and Volga Region | 0.63 | 0.57 | 0.56 |
| IDGC of South | 0.41 | 0.37 | 0.27 |
| TDC | 0.83 | 0.79 | 0.77 |
| Tyumenenergo | 0.85 | 0.82 | 0.80 |
| Yantarenergo | 0.40 | 0.42 | 0.33 |
Financial stability depends primarily on the amount of shareholders’ equity as the basis for corporate self-sufficiency and independency. A substantial share of shareholders’ equity in the companies’ balance sheet structure (≥ 50%) shows that they are financially independent enough.
An analysis of the structure of distribution grid companies’ assets and liabilities allows the conclusion that their financial standing is sufficiently stable.